SEE THE BIGGER PICTURE. CLEARLY.
Numbers alone don’t drive decisions. Clear insight does.
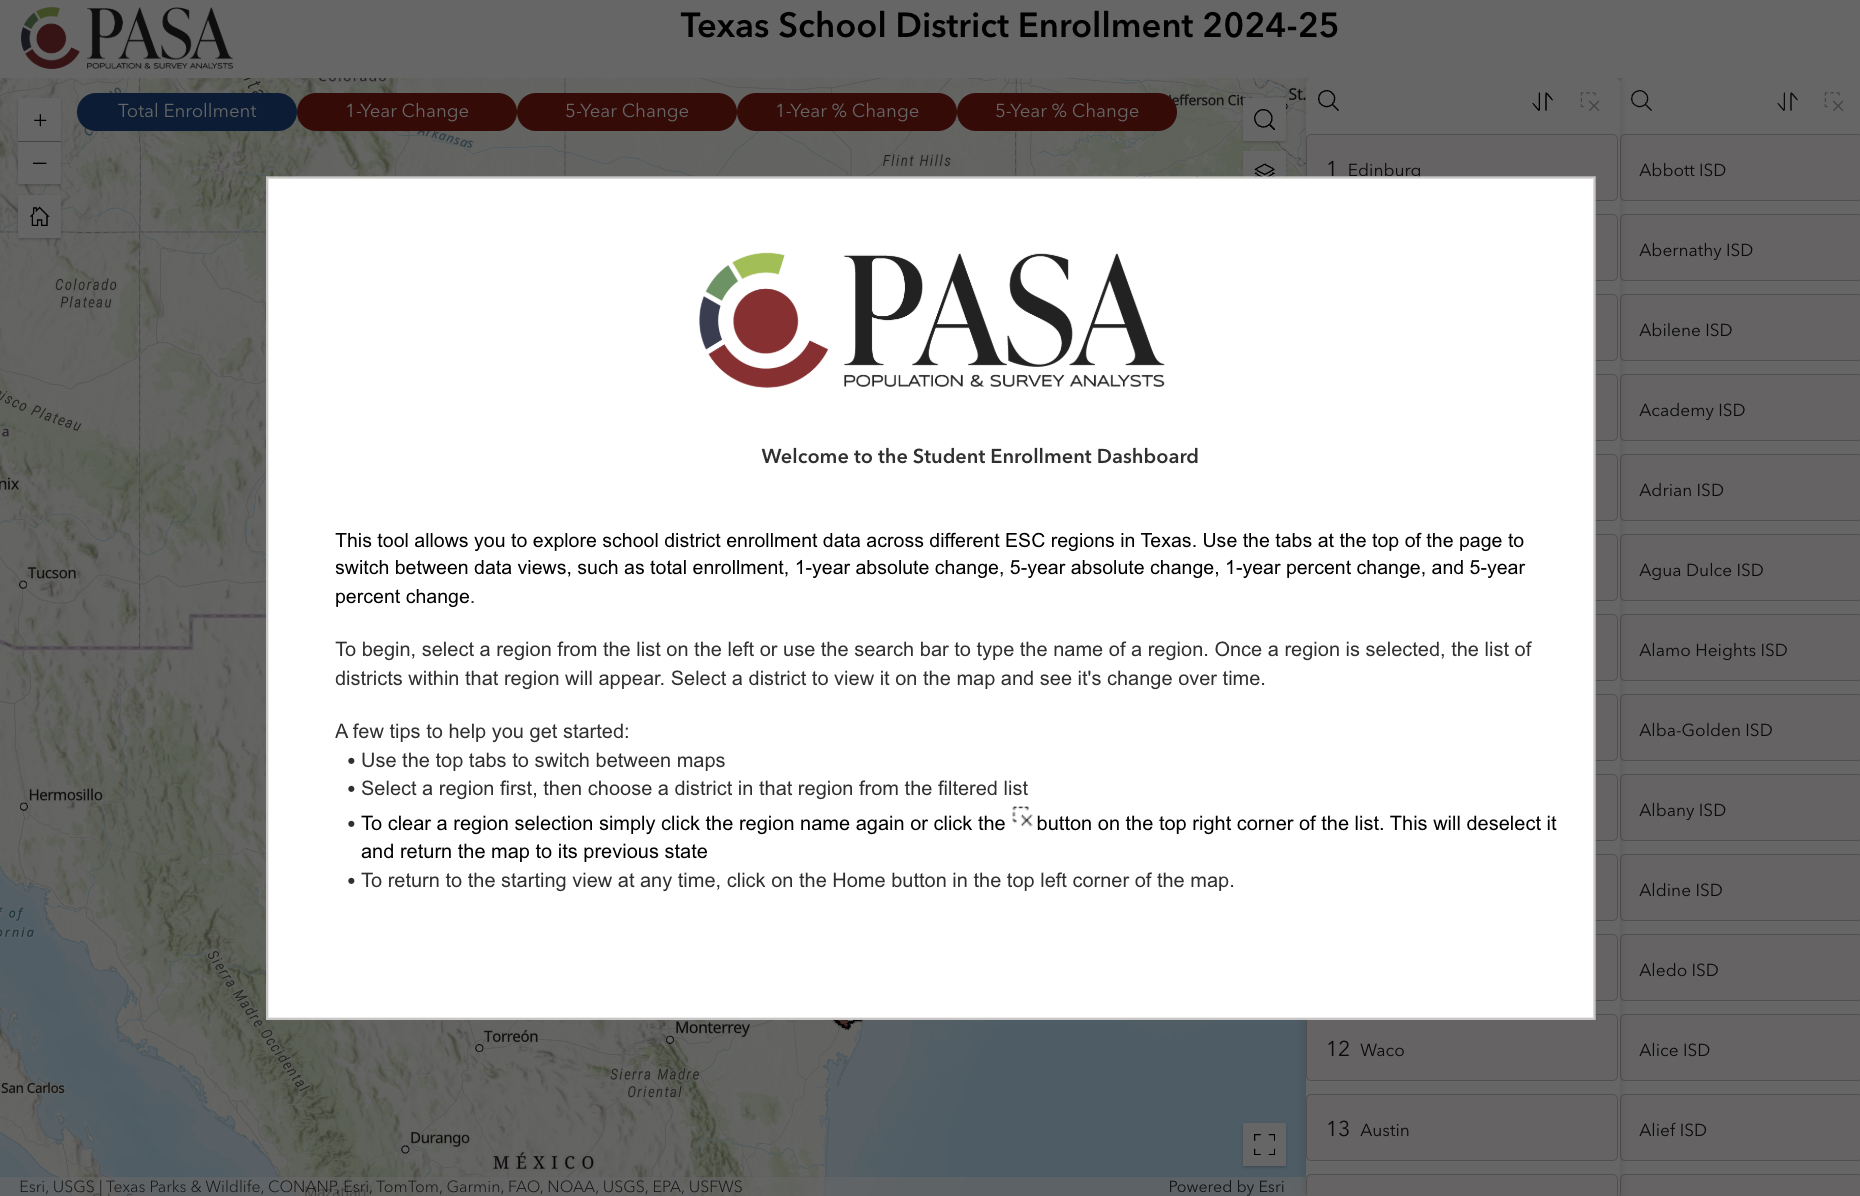
PASA’s interactive dashboards bring enrollment trends, housing growth, attendance zones, and demographic shifts into one visual tool, helping district leaders understand the data behind each recommendation.
Whether you’re presenting to the board, preparing for a bond, or reviewing boundary options, our dashboards make complex information easier to explore, explain, and act on.